

Introduction
In the rapidly evolving field of machine learning, the ability to evaluate model performance is paramount. As practitioners develop algorithms to classify data into distinct categories, understanding how well these models perform becomes essential. Among various evaluation metrics, the F1 Score has gained prominence for its ability to provide a balanced assessment of model effectiveness.
Precision and recall are two foundational metrics in classification tasks:
- Precision measures the accuracy of positive predictions, calculated as the ratio of true positive predictions to the total number of positive predictions (true positives + false positives). High precision indicates that the model makes few false positive errors, which is particularly important in scenarios where false positives can lead to significant costs or consequences.
- Recall, on the other hand, evaluates the model’s ability to identify all relevant instances by calculating the ratio of true positive predictions to the total number of actual positive instances (true positives + false negatives). A high recall indicates that the model successfully captures most of the positive cases, which is crucial in applications like disease detection where missing a positive case could be detrimental.
However, precision and recall often present a trade-off. Increasing precision may lead to a decrease in recall and vice versa. This is especially evident in imbalanced datasets, where one class may dominate the others, leading to skewed evaluations if only one of these metrics is considered.
The F1 Score addresses this challenge by providing a single metric that combines both precision and recall into a harmonic mean. This score ranges from 0 to 1, where a score of 1 indicates perfect precision and recall, while a score of 0 reflects poor performance. The F1 Score is particularly useful in scenarios where the balance between precision and recall is critical, making it an indispensable tool for data scientists and machine learning engineers.
In this article, we will explore the calculation of the F1 Score, its significance in various applications, and how it can guide practitioners in optimizing their models. By gaining a deeper understanding of the F1 Score, readers will be better equipped to evaluate their classification models and make data-driven decisions that enhance predictive accuracy and reliability.
Key Terms and Formulas
In classification tasks, it’s essential to understand the fundamental concepts that contribute to model evaluation. The following terms are crucial for calculating various performance metrics:
- True Positive (TP): The number of positive instances that were correctly predicted by the model. For example, in a medical diagnosis scenario, TP represents patients who have a disease and were correctly identified as having it.
- False Positive (FP): The number of negative instances that were incorrectly predicted as positive by the model. Continuing with the medical example, FP represents healthy patients who were incorrectly diagnosed as having the disease.
- True Negative (TN): The number of negative instances that were correctly predicted by the model. In our medical context, TN represents healthy patients who were correctly identified as not having the disease.
- False Negative (FN): The number of positive instances that were incorrectly predicted as negative by the model. This would include patients who have the disease but were not diagnosed as such.
Performance Metrics
- Accuracy:
- Definition: Accuracy measures the overall correctness of the model’s predictions.
- Formula:

- Interpretation: It indicates the proportion of total predictions that were correct. While accuracy is a useful metric, it can be misleading in imbalanced datasets.
2. Precision:
- Definition: Precision measures the accuracy of positive predictions.
- Formula:
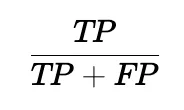
- Interpretation: High precision indicates that the model makes few false positive errors, which is crucial in scenarios where false positives carry significant costs.
3. Recall:
- Definition: Recall measures the ability of the model to identify all relevant instances.
- Formula:
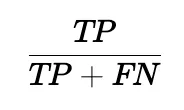
- Interpretation: High recall means that most positive cases are identified, which is particularly important in applications like fraud detection or disease screening.
4. F1 Score:
- Definition: The F1 Score combines precision and recall into a single metric, providing a balance between the two.
- Formula:
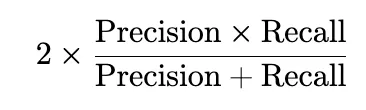
- Interpretation: The F1 Score is particularly useful when dealing with imbalanced datasets, as it emphasizes the importance of both precision and recall. A higher F1 Score indicates a better balance between the two metrics.
Code Explanation
import numpy as np
Importing Libraries: The code begins by importing the NumPy library, which is essential for numerical operations and handling arrays efficiently.
df = np.array([
    [True, False],
    [True, False],
    [True, True],
    [False, True],
    [False, False],
    [True, False],
    [True, True],
    [False, True],
    [False, False],
    [True, False],
    [True, False],
    [True, False],
    [True, True],
    [True, True],
    [False, True],
])
print(df)
print(df.shape)
- Creating the Dataset: A NumPy array
dfis created, representing a dataset with two columns: - The first column indicates the model’s predictions (True or False).
- The second column indicates the actual labels (True or False).
- Printing the Dataset: The dataset is printed, along with its shape, which shows the number of rows (samples) and columns (features).
positives = df[df[:, 1] == True]
print(positives)
Filtering Positive Instances: The code filters out the instances where the actual label (second column) is True, storing them in the positives variable. This represents all the positive cases in the dataset.
tp = positives[positives[:, 0] == True]
tp_count =  tp.shape[0]
print("count of TP:", tp_count)
Calculating True Positives (TP): The code further filters the positives array to find True Positives, where the model’s prediction (first column) is also True. The count of True Positives is stored in tp_count and printed.
fp = positives[positives[:, 0] == False]
fp_count =  fp.shape[0]
print("count of FP:", fp_count)
Calculating False Positives (FP): The code attempts to find False Positives by filtering the positives array for instances where the model’s prediction is False. The count is stored in fp_count and printed. However, this approach is incorrect since False Positives should be calculated from the total predictions, not just the positives.
negatives = df[df[:, 1] == False]
print(negatives)
Filtering Negative Instances: Similar to the positives, the code filters the dataset to find instances where the actual label is False, storing them in the negatives variable.
tn = negatives[negatives[:, 0] == False]
tn_count =  tn.shape[0]
print("count of TN:", tn_count)
Calculating True Negatives (TN): The code filters the negatives array to find True Negatives, where the model’s prediction is also False. The count is stored in tn_count and printed.
fn = negatives[negatives[:, 0] == True]
fn_count =  fn.shape[0]
print("count of TN:", fn_count)
Calculating False Negatives (FN): The code attempts to find False Negatives by filtering the negatives array for instances where the model’s prediction is True. The count is stored in fn_count and printed. However, there is a mistake in the print statement where it incorrectly labels the output as “count of TN.”
accuracy = (tp_count + tn_count) / (tp_count + fp_count + tn_count + fn_count)
print("accuracy:", accuracy)
Calculating Accuracy: The accuracy is calculated as the ratio of correctly predicted instances (TP + TN) to the total number of instances (TP + FP + TN + FN). The result is printed.
precision = round(tp_count / (tp_count + fp_count), 3)
print("precision:", precision)
Calculating Precision: Precision is calculated as the ratio of True Positives to the sum of True Positives and False Positives. The result is rounded to three decimal places and printed.
recall = round(tp_count / (tp_count + fn_count), 3)
print("recall:", recall)
Calculating Recall: Recall is calculated as the ratio of True Positives to the sum of True Positives and False Negatives. The result is rounded and printed.
f1_score = round(2 * precision * recall / (precision + recall), 3)
print("f1_score:", f1_score)
Calculating F1 Score: The F1 Score is calculated using the harmonic mean of precision and recall. The result is rounded and printed.
Conclusion
In this analysis, we explored the calculations of various performance metrics used to evaluate the effectiveness of a classification model. By utilizing a simple dataset represented as a NumPy array, we were able to derive key metrics: True Positives (TP), False Positives (FP), True Negatives (TN), and False Negatives (FN). These metrics form the foundation for calculating more comprehensive performance indicators such as Accuracy, Precision, Recall, and the F1 Score.
- Accuracy provides a general overview of how well the model performs across all instances, but it may not be reliable in cases of imbalanced datasets.
- Precision focuses on the quality of positive predictions, highlighting the model’s ability to avoid false alarms.
- Recall emphasizes the model’s effectiveness in identifying all relevant positive cases, which is crucial in scenarios where missing a positive instance can have significant consequences.
- The F1 Score serves as a balanced measure, combining both precision and recall, making it particularly useful in situations where the trade-off between these two metrics is essential.
By understanding and correctly implementing these calculations, practitioners can make informed decisions regarding model selection, tuning, and deployment. The importance of accurately computing each metric cannot be overstated, as it directly impacts the model’s reliability and effectiveness in real-world applications. Overall, this exercise underscores the necessity of rigorous evaluation in machine learning, ensuring that models not only perform well statistically but also meet the practical needs of their intended use cases.
Full Code
import numpy as np

df = np.array([
    [True, False],
    [True, False],
    [True, True],
    [False, True],
    [False, False],
    [True, False],
    [True, True],
    [False, True],
    [False, False],
    [True, False],
    [True, False],
    [True, False],
    [True, True],
    [True, True],
    [False, True],
])
print(df)
print(df.shape)

positives = df[df[:, 1] == True]
print(positives)

tp = positives[positives[:, 0] == True]
tp_count =  tp.shape[0]
print("count of TP:", tp_count)

fp = positives[positives[:, 0] == False]
fp_count =  fp.shape[0]
print("count of FP:", fp_count)

negatives = df[df[:, 1] == False]
print(negatives)

tn = negatives[negatives[:, 0] == False]
tn_count =  tn.shape[0]
print("count of TN:", tn_count)

fn = negatives[negatives[:, 0] == True]
fn_count =  fn.shape[0]
print("count of TN:", fn_count)

accuracy = (tp_count + tn_count) / (tp_count + fp_count + tn_count + fn_count)
print("accuracy:", accuracy)

precision = round(tp_count / (tp_count + fp_count), 3)
print("precision:", precision)

recall = round(tp_count / (tp_count + fn_count), 3)
print("recall:", recall)

f1_score = round(2 * precision * recall / (precision + recall), 3)
print("f1_score:", f1_score)
Check out my GitHub for projects, code samples, and contributions to open-source initiatives!